For you interested in investing in Japanese stocks, I introduce one of leading companies in Japan!
The financial performance and financial condition of the company are presented in charts and graphs.
I hope you’ll use it to your investment advantage!
Today, I will introduce Sony Group Corporation (stock code: 6758)!
■Company Profile
・Japan’s leading conglomerate with a wide range of businesses including games, AV equipment, music, movies, imaging sensors, and finance.
・Market capitalization is No. 2 in Japan, second only to Toyota Motor Corporation!
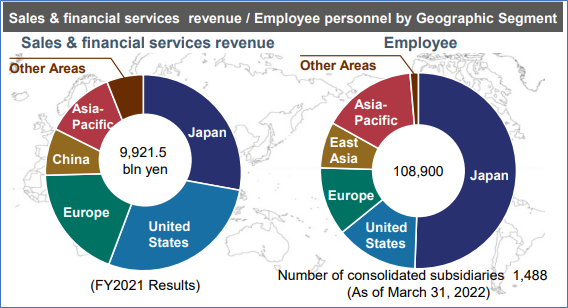
・More than 70% of its sales are overseas.
・About half of its employees are outside Japan.
■Financial Performance and Financial Condition
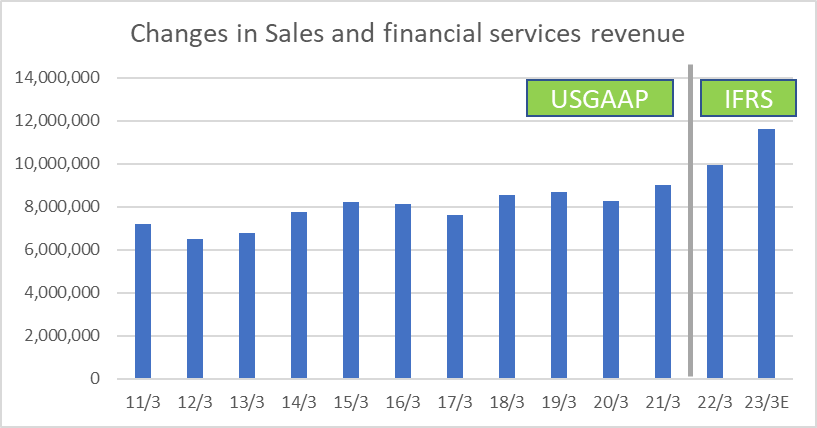
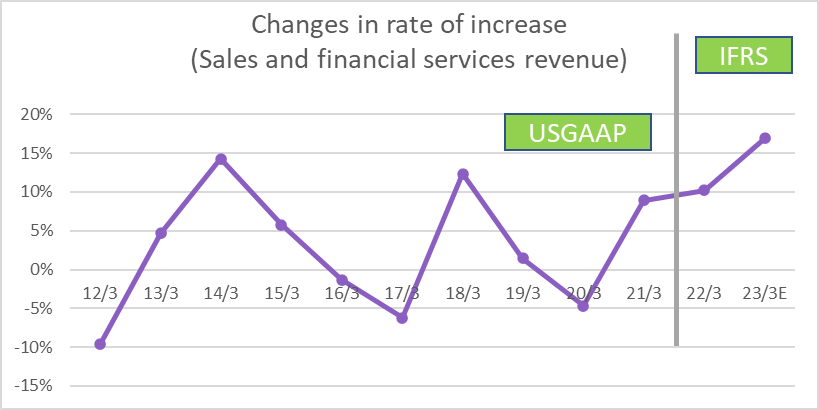
The following amounts are in “millions of yen”.
・Sales and financial services revenue
・Rate of Increase (Sales and financial services revenue)
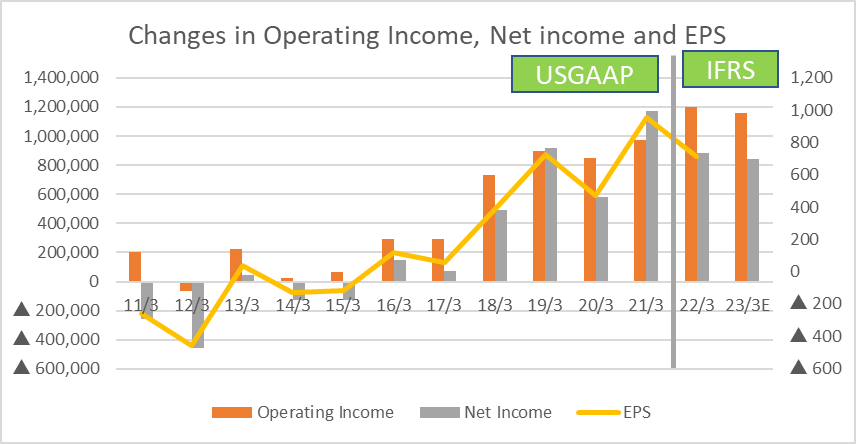
・Operating Income, Net Income and EPS
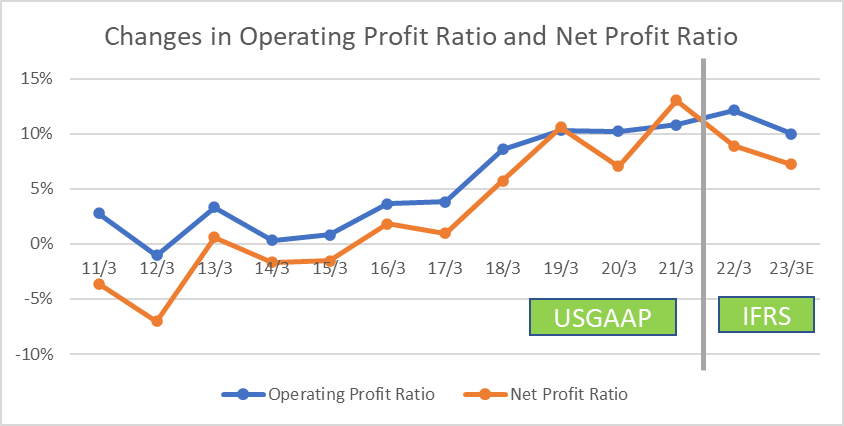
・Operating Profit Ratio and Net Profit Ratio
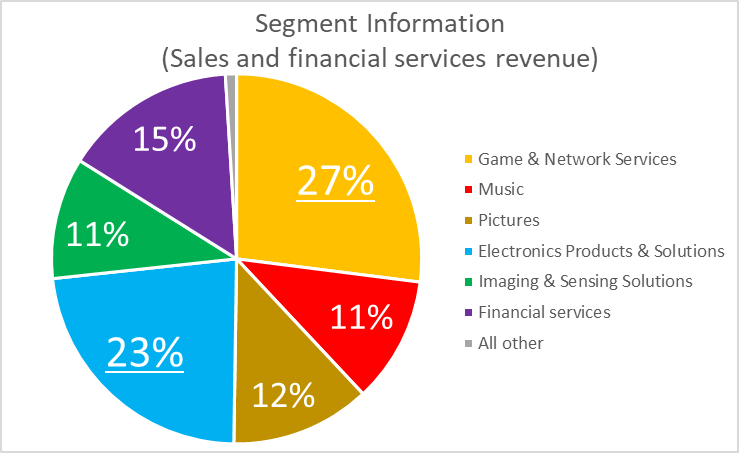
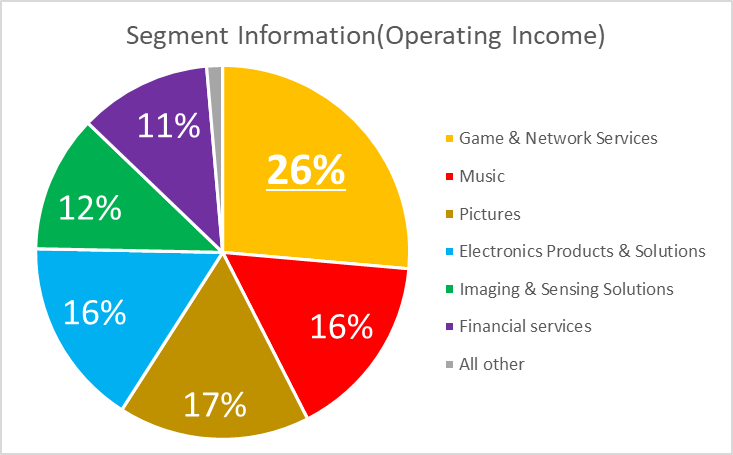
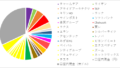
・Segment Information (Sales and financial services revenue, Operating Income, FY2021)
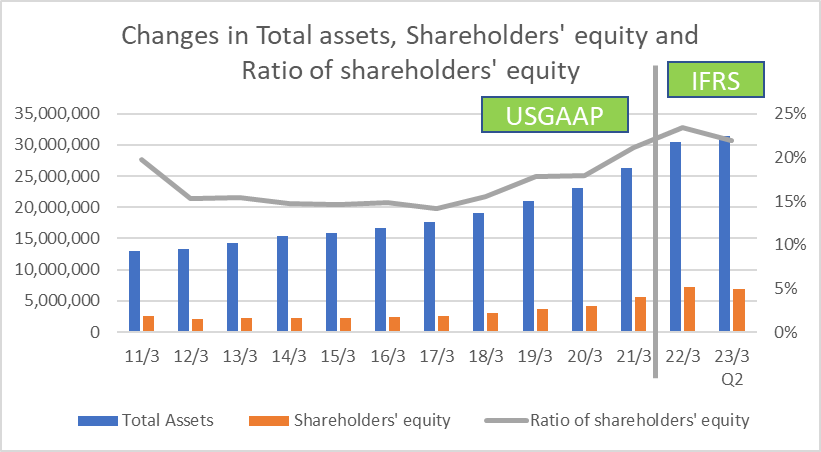
・Total assets, Shareholders’ equity and Ratio of shareholders’ equity
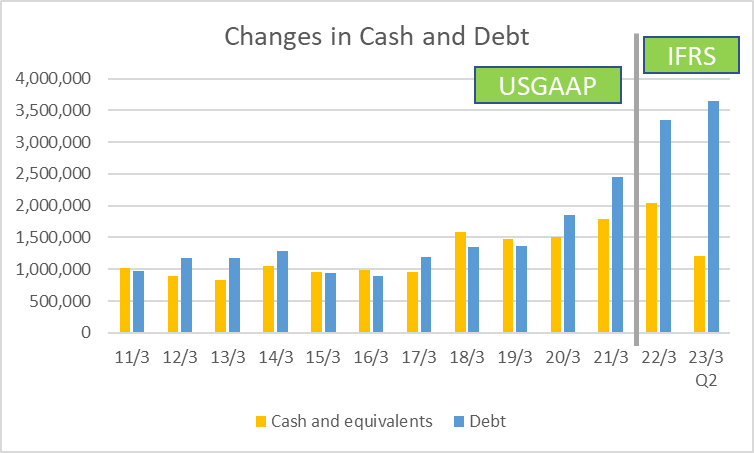
・Cash and Debt
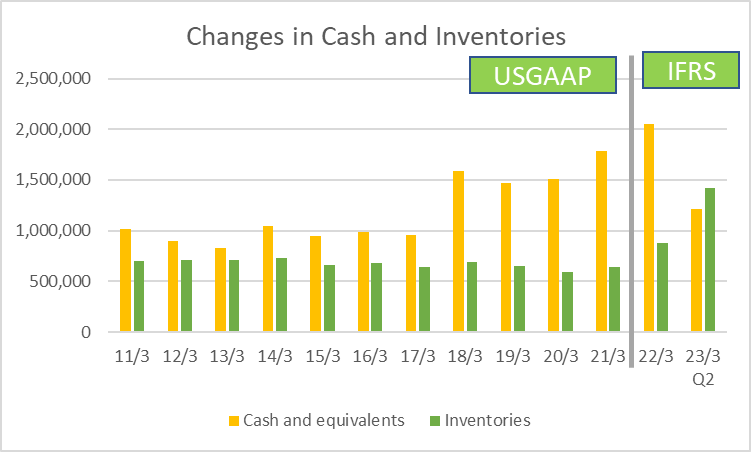
・Cash and Inventories
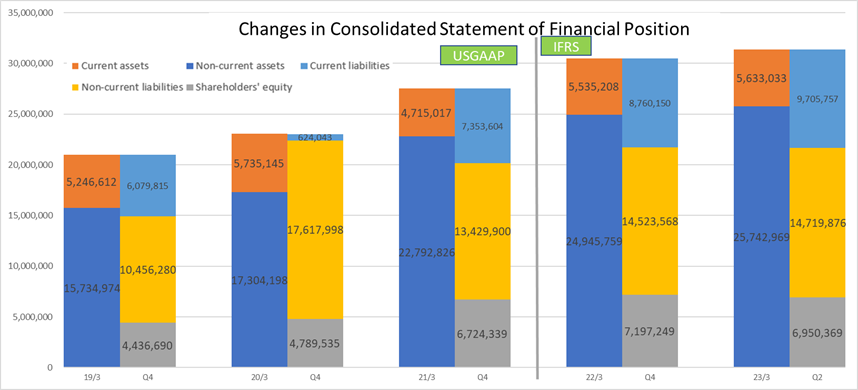
・Consolidated Statement of Financial Position
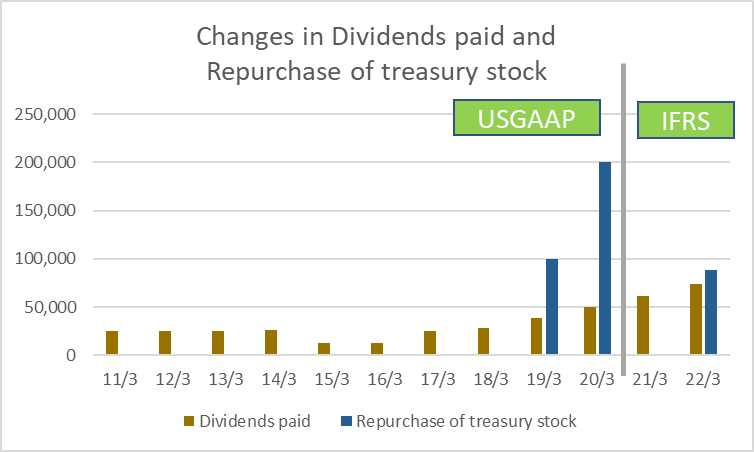
・Dividends and Repurchase of treasury stock
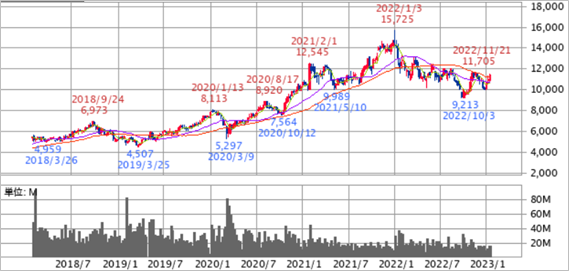
■Stock Price Information(Closing price on Jan 20, 2023)
Stock Price : 11,430 JPY
PER (Forecast) : 16.22 x
PBR (Forecast) : 2.05 x
Dividend yield (Forecast) : 0.61%
Thank you for reading!
I wish you success with your investment!

コメント