
決算の内容を知りたいけど、数字ばかりで読む気が起きない!
そうですよね、私もそうでした。
でも不思議なことに、ひと手間かけて、グラフにすると、多くの気づきがあったのです。
グラフでサクッと決算を理解していきましょう!
「変化」や「違和感」、視覚的に捉えることで投資のヒントになるはずです!
アライドアーキテクツの2023年12月期決算を見ていきます。
■決算概要(ここだけは数字ですみません。。)
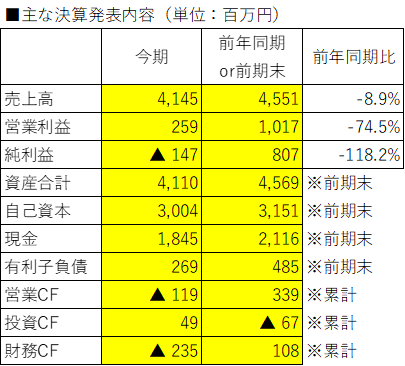
※PL:2023年1-12月の12ヶ月
※BS:2023年12月末時点
※CF:2023年1~12月のCF
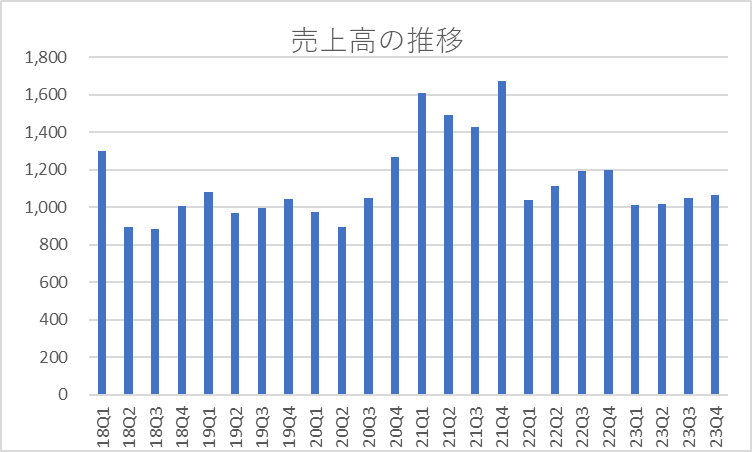
■売上高の四半期推移
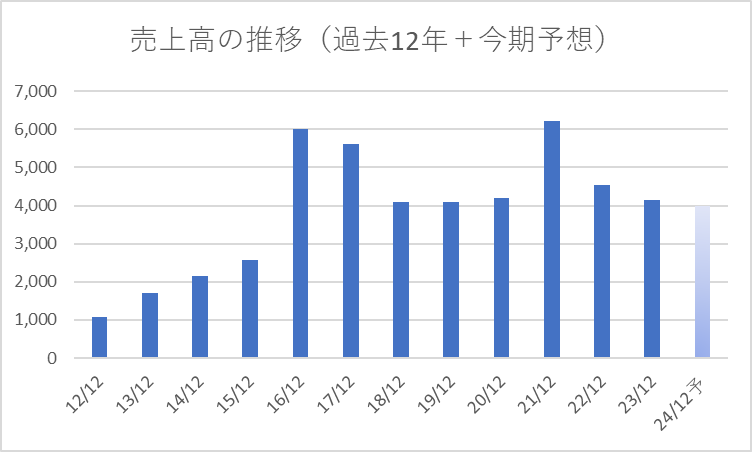
■売上高の推移(過去12年+今期予想)
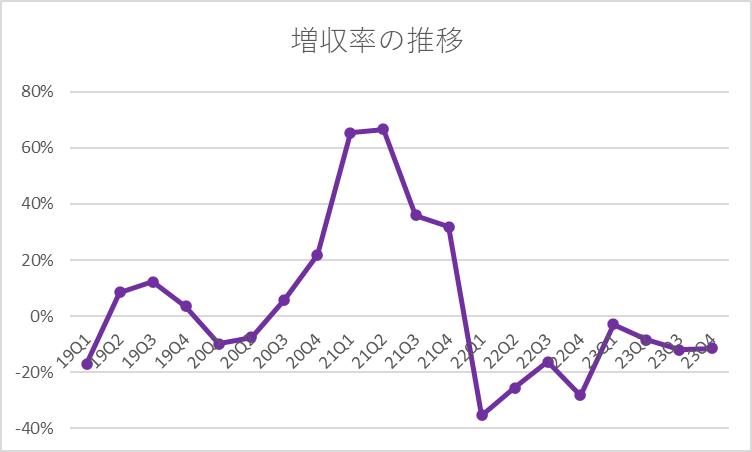
■増収率の四半期推移
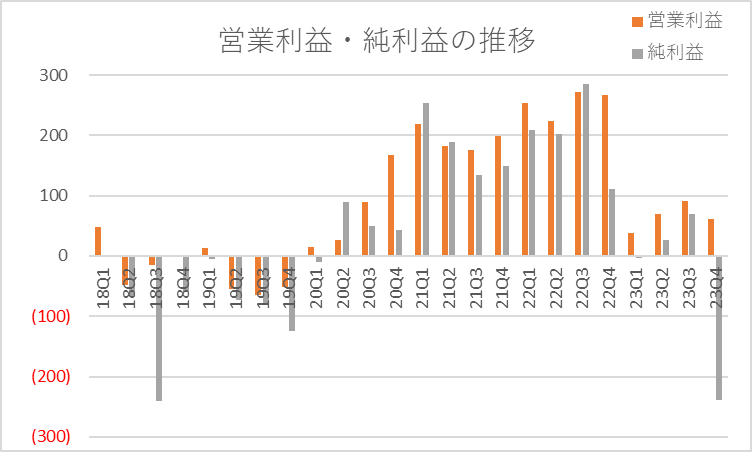
■営業利益・純利益の四半期推移
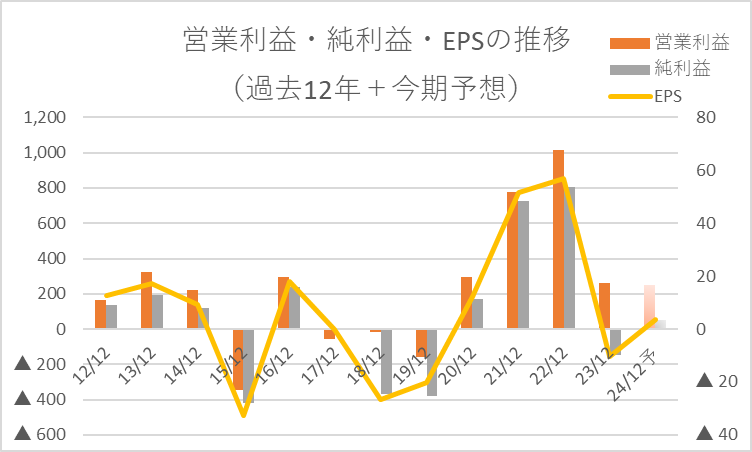
■■営業利益・純利益の推移(過去12年+今期予想)
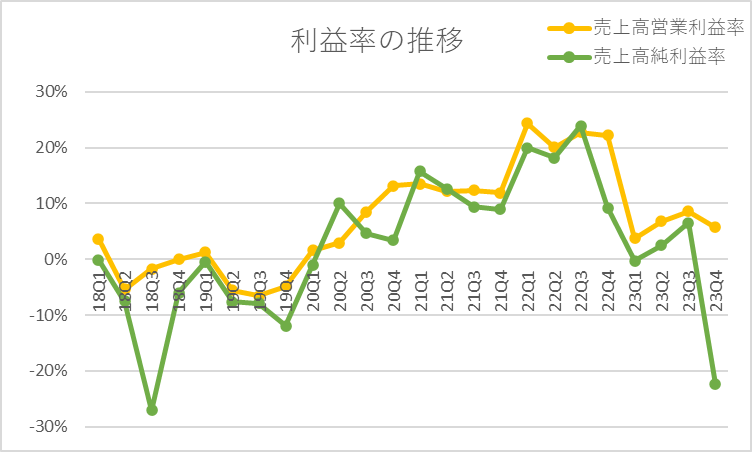
■利益率の四半期推移
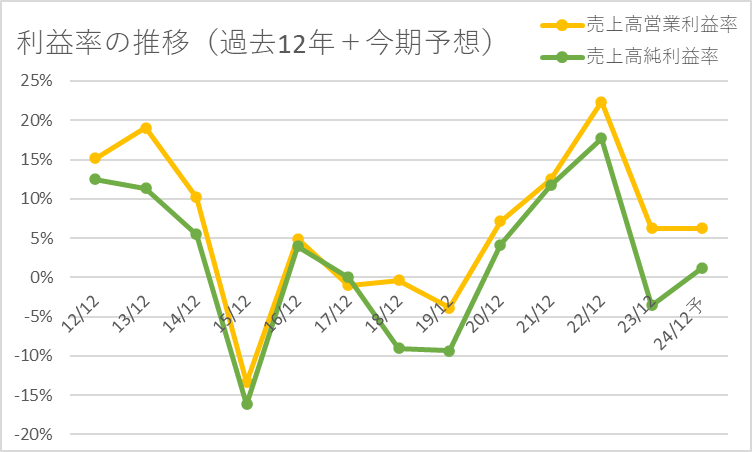
■利益率の推移(過去12年+今期予想)
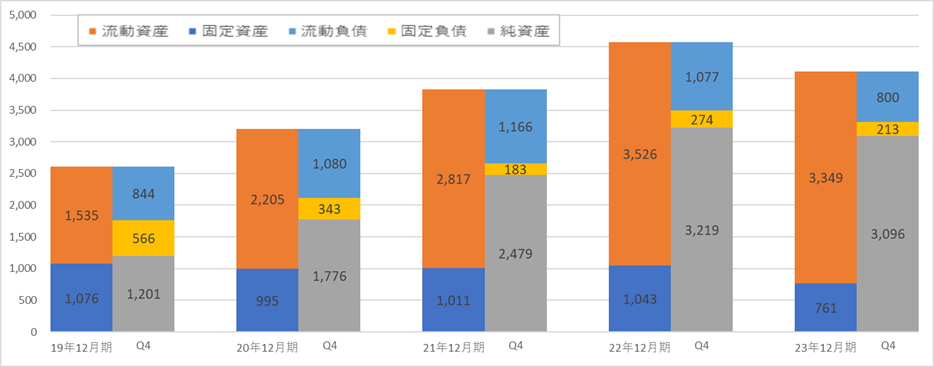
■BSの推移
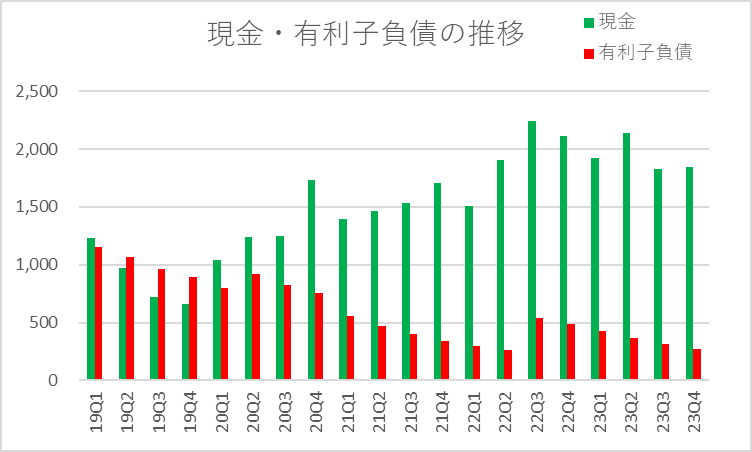
■現金・有利子負債の四半期推移
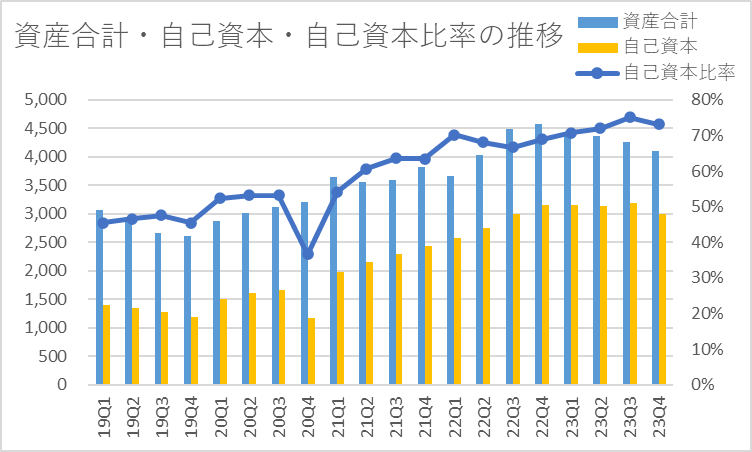
■資産合計・自己資本・自己資本比率の四半期推移
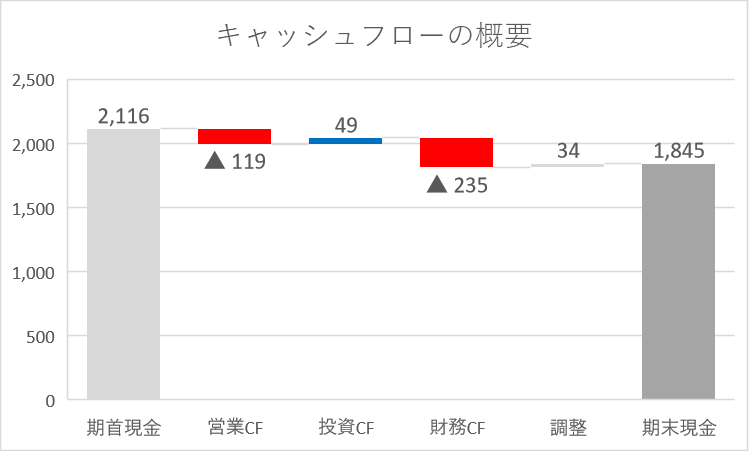
■CFの概要


コメント