決算の内容を知りたいけど、数字ばかりで読む気が起きない!
そうですよね、私もそうでした。
でも不思議なことに、ひと手間かけて、グラフにすると、多くの気づきがあったのです。
グラフでサクッと決算を理解していきましょう!
「変化」や「違和感」、視覚的に捉えることで投資のヒントになるはずです!
楽天グループの2023年12月期決算を見ていきます。
■決算概要(ここだけは数字ですみません。。)
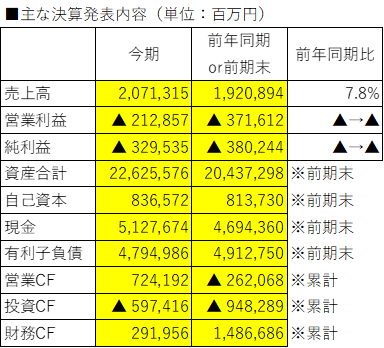
※PL:2023年1-12月の12ヶ月
※BS:2023年12月末時点
※CF:2023年1~12月のCF
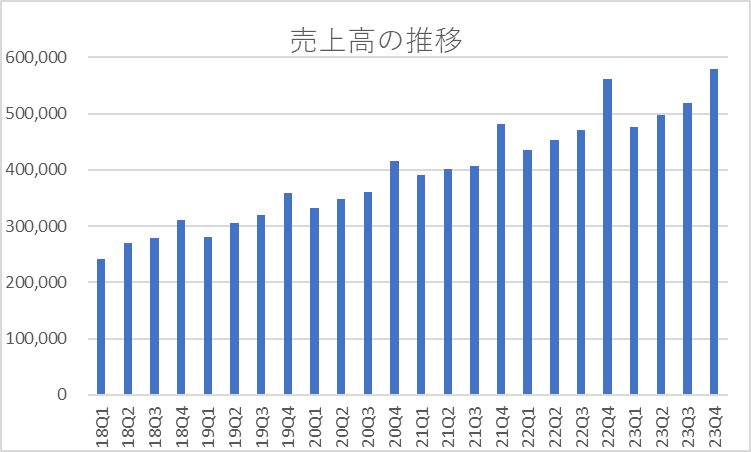
■売上高の四半期推移
■売上高の推移(過去13年)
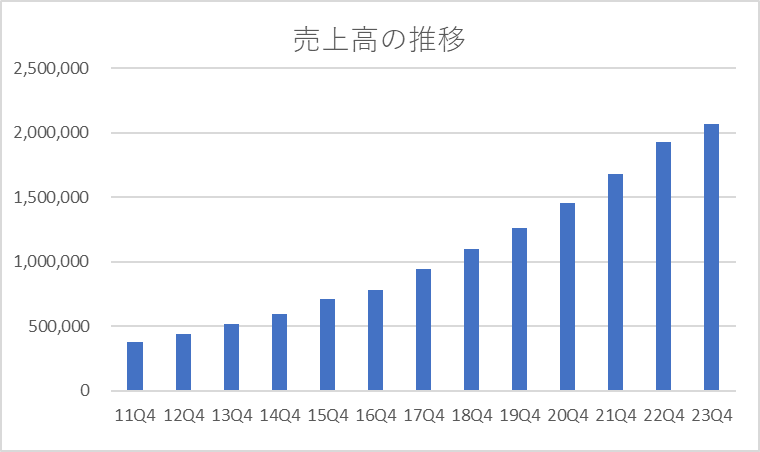
売上高はしっかり伸び続けています。
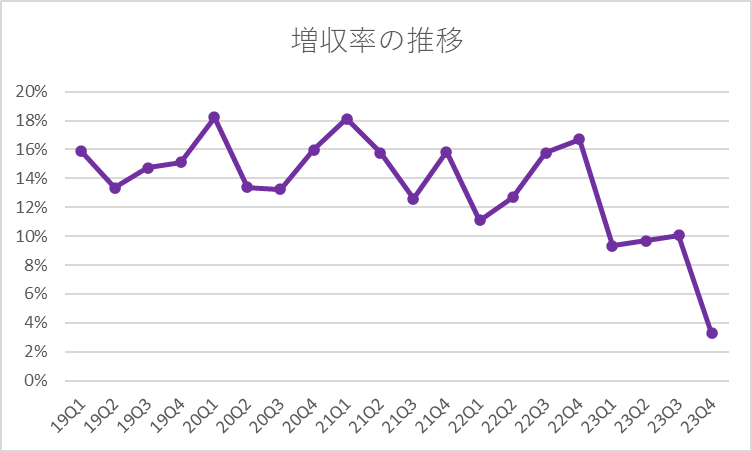
■増収率の四半期推移
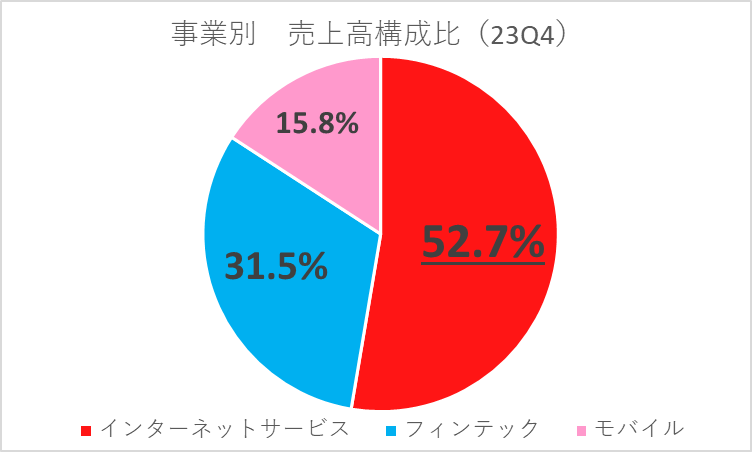
■事業別売上高構成比
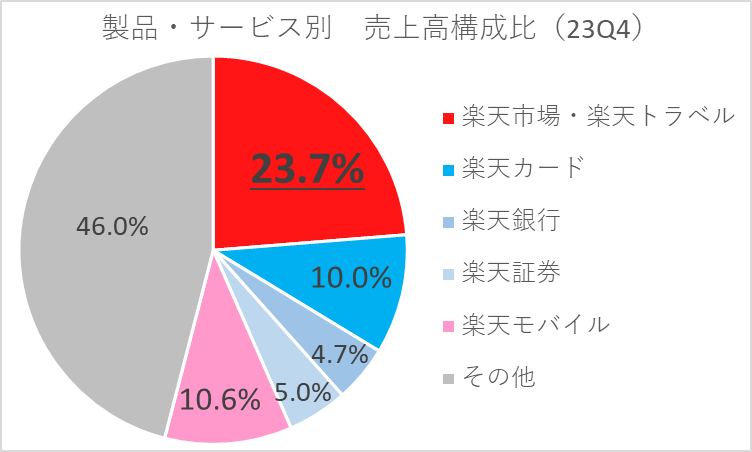
■製品・サービス別売上高構成比
■地域別売上高構成比
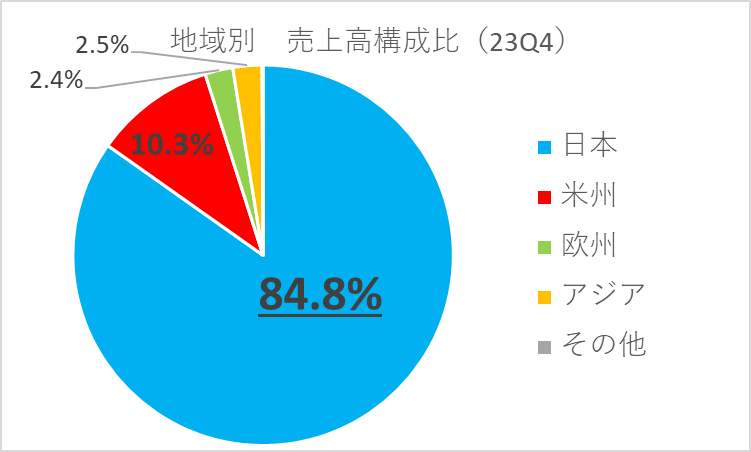
社内公用語=英語ですし、グローバルに展開しているイメージでしたが、意外にもほとんどが日本。
■営業利益・純利益の四半期推移
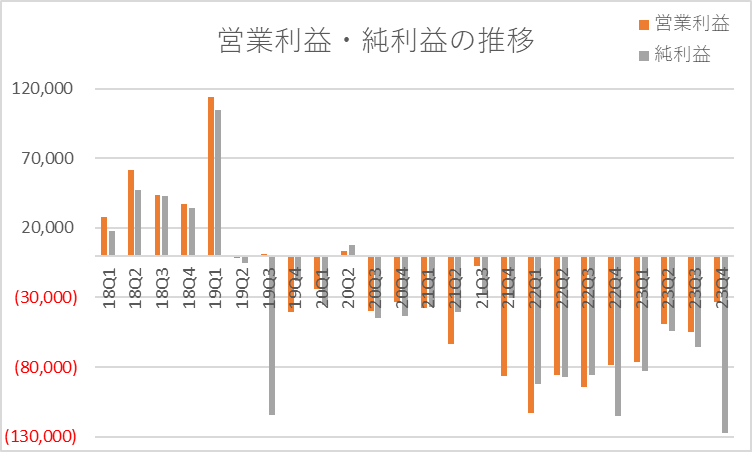
■■営業利益・純利益の推移(過去13年)
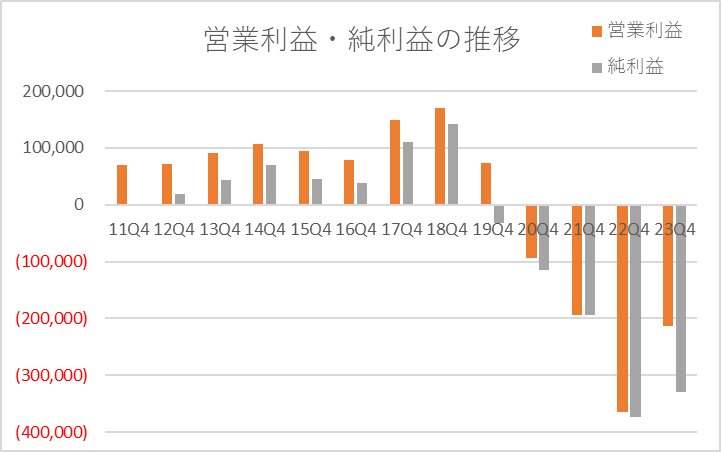
営業利益は2020年から、純利益は2019年から、連続赤字です。。。
■セグメント損益
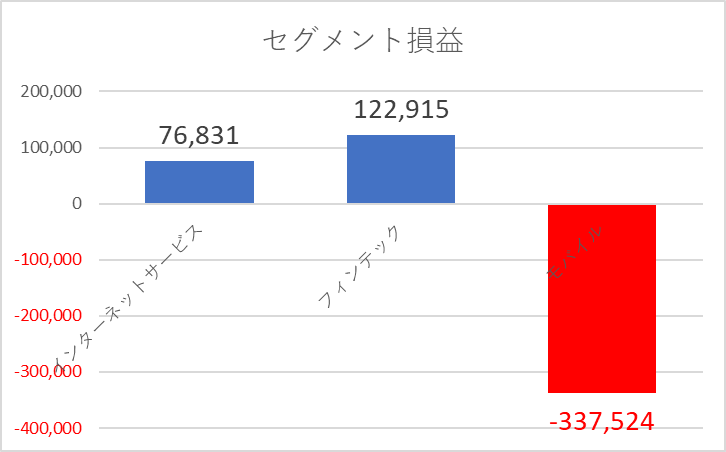
やはり課題はモバイル事業・・・。
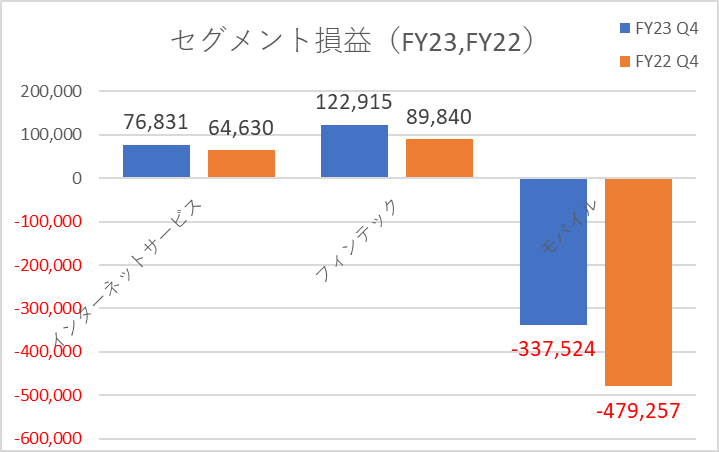
改善はしてきていますが・・・。
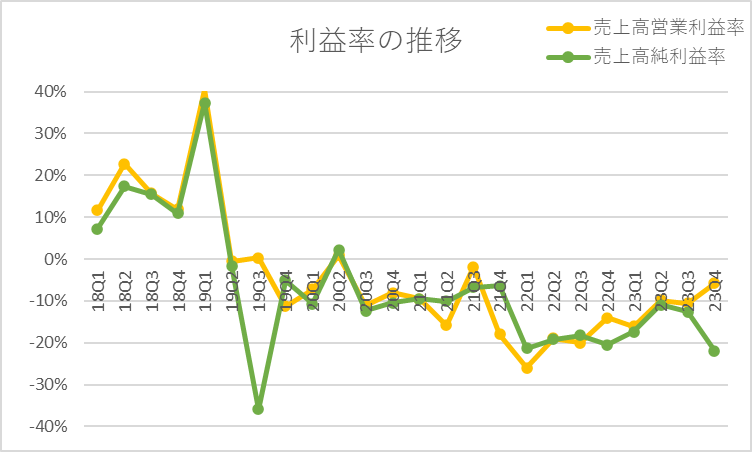
■利益率の四半期推移
■利益率の推移(過去13年)
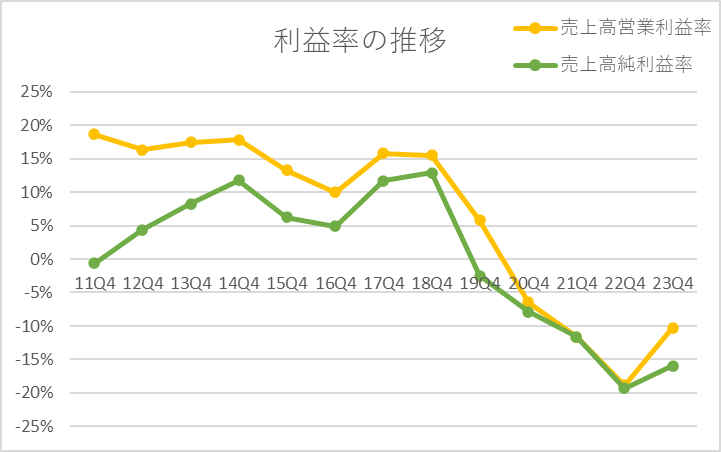
モバイル事業参入前は営業利益率は2桁を超えて良かったのですが・・・
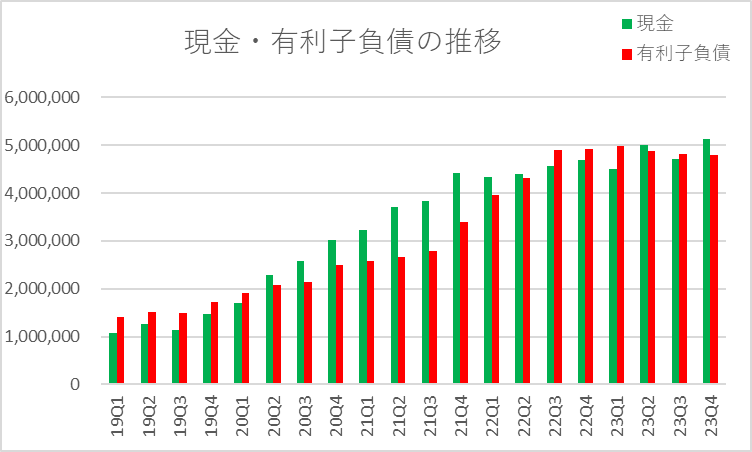
■現金・有利子負債の四半期推移
■現金・有利子負債の推移(過去13年)
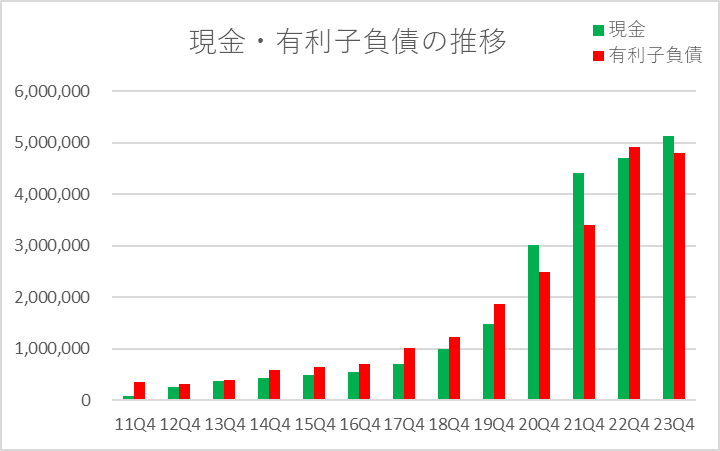
有利子負債、、、増えてますね。
■資産合計・自己資本・自己資本比率の四半期推移
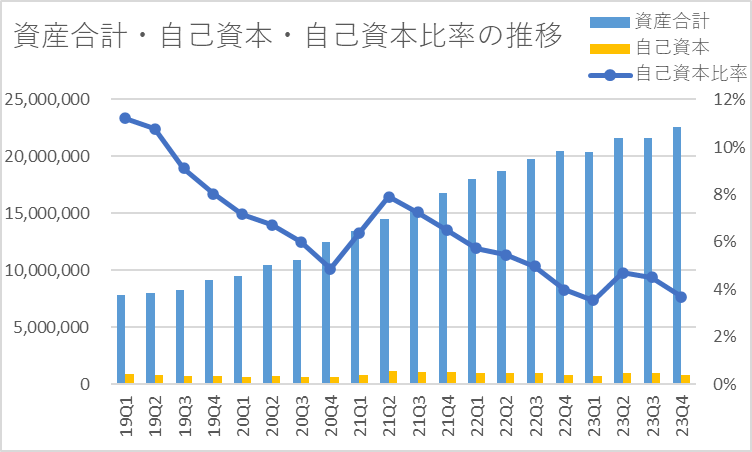
自己資本比率がじわじわと・・・
■CFの概要
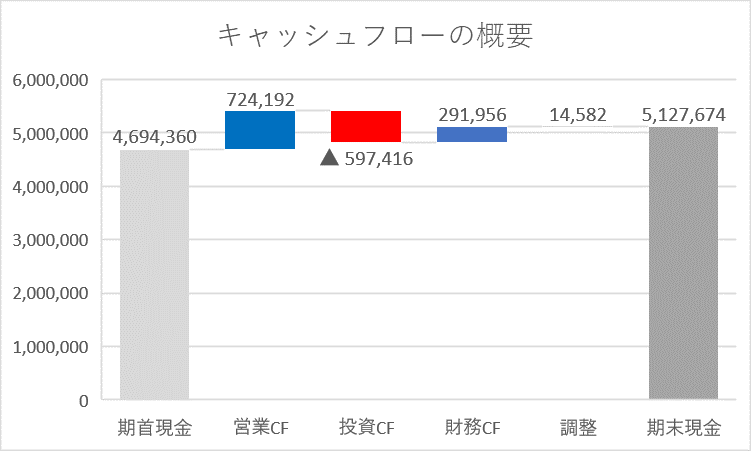
前期は営業CFがマイナスでしたので、改善はしているようですね。

コメント